Related information:
Quoting by span: Assembly Cost/ or Time by Component Count Span Report for
Quoting
Quoting by p/n:
Assembly or Parts Cost or Time by Part Number Report for Quoting
Quoting/quality from solder joints: Solder Joint Count Report. Defect Per
Million Operations (DPMO)
Quoting from gerbers: Quoting Using Only Gerber
Files
Cycle Time is the time it takes to assemble a PC Board and in this case we are
dealing with the time it takes to insert the components on the PCB.
For example if you have a certain amount of Surface
Mount Devices (SMD) and Thru Hole Devices (THD) on your PCB assembly ( PCBA ) and there being
inserted at various machines and operations then how long will it take to do the
component placements either automatically or manually.
There are two methods for calculating Cycle Times with the Unisoft software, Cycle Times by component span and Cycle Times by part number.
For calculating assembly costs click here.
Cycle Times by component span - method #1
This method calculates the cycle time by component span and is usually the
preferred and easier method.
This method uses a component span template which can
be used to represent time or costs and if you wish to calculate Cycle Times then the numbers used
in the template represent time. These templates are located under “Assembly Cost
or Cycle Times by
Component Span” under the “Quote/Quality” menu.
In the figure that follows we created a template
titled Cycle Time - automatic or manual insert of 1 part in
seconds . So in this template we used the time required for insertion placement for 1 component
in
seconds (note "seconds" are preferred). So essentially this would be the time to place 1 component
package in a
particular category in the time unit of seconds.
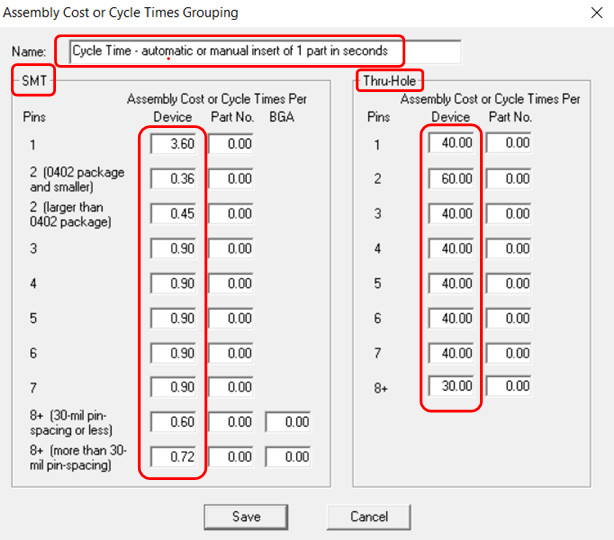
For example for SMD components in the
template table above we have listed for the component category SMT 2 (larger than
0402 package) the number 0.45 which stands for 0.45 seconds
for 1 placement of that package type. So 0.45 seconds for 1 component
insertion would equate to that machine placing 8,000 components in 1 hour in
that category - 1 hour=3600 seconds (3600/0.45=8,000).
As an example for THD components in the
template table above we have listed for the component category THD Pin=2 the
number 60.00 which stands for 60 seconds for 1
placement of that package type. So 60 seconds for 1 component insertion
would equate to hand placing 60 components in 1 hour in that category.
From the template window in the Unisoft software in
the figure below we generated the tab delimited Excel output report for the
template we created above. It breaks down the times per category for both
SMD and THD device types.
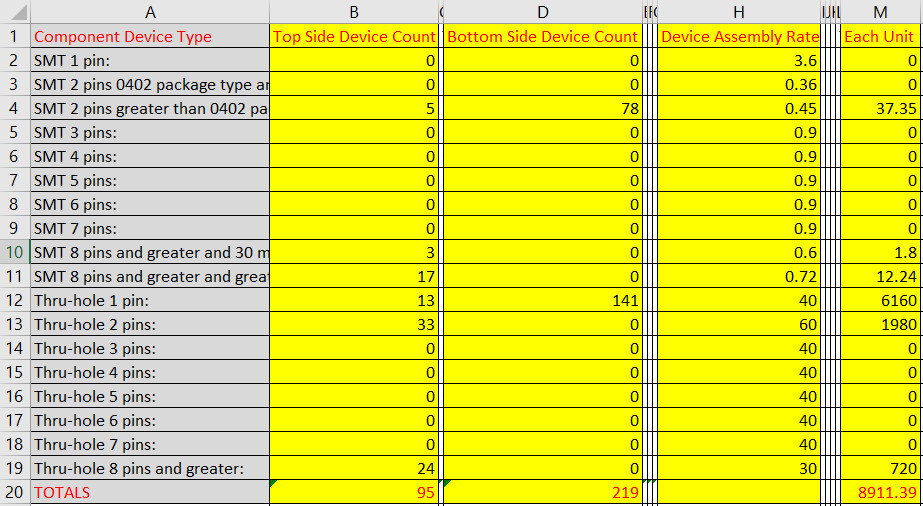
So in the figure above for the component category
SMT 2 pins greater than 0402 package: we see that there are 5 components on
the top side and 78 on the bottom with the rate of 0.45 seconds for 1
package placement and the total time required is 37.35 seconds.
In the figure above for the component category Thru-hole 2 pins: we see that there are 33 components on the top side and 0 on the bottom with the rate of 60 seconds for hand placement of 1 package and the total time required is 1980 seconds.
Cycle Times by part number - method #2
The second method for calculating cycle times is
Cycle Times by part number. Note Method # 1 Cycle Times by component span
is usually the preferred method.
--------------------
You can quickly create a Cycle Time by part number report. This report is used
by Contract and OEM manufacturers to quickly estimate Cycle Times. The report
contains the totals for the PC Board and breakdown by part number.
Total = 1973.66 seconds
----
381200-40-1 1 0.90 0.90
381212-44-1 4 60.00 240.00
385848-05-6 32 3.60 115.20
386754-99-4 1 40.00 40.00
389148-06-7 1 3.60 3.60
390579-03-3 1 90.00 90.00
390607-01-0 1 80.00 80.00
391727-10-9 16 0.45 7.20
391727-12-5 16 0.36 5.76
391727-13-3 1 0.90 0.90
391727-14-1 5 0.90 4.50
391729-02-0 16 0.90 14.40
391770-01-2 1 40.00 40.00
391770-02-0 1 0.90 0.90
391777-06-8 11 0.90 9.90
391777-08-4 16 0.90 14.40
391781-01-4 2 3.60 7.20
391809-01-6 1 40.00 40.00
391818-06-6 3 3.60 10.80
391822-01-2 1 3.60 3.60
391822-02-0 1 3.60 3.60
391822-03-9 1 3.60 3.60
391829-03-3 1 90.00 90.00
395382-01-7 1 90.00 90.00
395383-01-3 1 90.00 90.00
395422-01-9 8 0.90 7.20
396051-01-4 16 60.00 960.00
Creating
the Cycle Times by part number report:
The Cycle Time by Part Number Report uses the
part numbers to group together components times to determine the total cycle time.
To use the Cycle Time by Part Number method
you need to create a simple text file Library (.OPR) file with a minimum of two
elements per line: 1) The part number. 2) The
placement time for 1 component and it is recommended that it be in seconds.
You
can have as many Library (.OPR) files as you desire. For example you can have
one large Library (.OPR) file with as many Part Numbers in it as you wish or if
you're a contract manufacturer one for each customer you may have.
391727-10-9 Placement time for 1 component in seconds 0.45
391727-12-5 Placement time for 1 component in seconds 0.36
381200-40-1 Placement time for 1 component in seconds 0.90
391727-13-3 Placement time for 1 component in seconds 0.90
In the .OPR file above the part number is in
the first field followed by a TAB then the second field is the text instruction
field (Example: Placement time for 1 component in seconds) and this field is
optional and can be left blank. Next is another TAB and then the third field is
the rate field and this field can represent either time or money and in our case
here for cycle time it will represent time in seconds.
So in the
example .OPR above for the part number
391727-10-9 we see that
the rate is 0.45 seconds for 1 component package placement.
After you have created the .OPR file with the
part numbers and rate, open the desired PC Board with the BOM imported using the
Unisoft software. Next click FILE then then IMPORT LIBRARY (.OPR) and a new
window will appear. In the window point to and select the .OPR file you have
created and then click OPEN. Next to generate the Report click QUOTE/QUALITY
from the Main then click PARTS OR ASSEMBLY COST OR CYCLE TIMES BY PART NUMBER and the report
appears.
Note that to get the Assembly or Parts Cost by
Part Number Report it is not required to have the actual CAD or Gerber files
imported into the Unisoft software, you can import only the BOM and then import
the Library (.OPR) file and then create your report from the Unisoft software.
However be aware when using this method of only importing the BOM file you will
usually not receive the cross-checking necessary to determine the "Do Not
Install's" or any other item that may be wrong in the BOM before you generate
the report.
Also see - Assembly Cost by Component Span Report for Quoting templates
menu.
https://www.unisoft-cim.com/view-markup_download.htm#ASSIGNING_OPERATIONS_TEXT_TO_EACH_PART_NUMBER
https://www.unisoft-cim.com/features.htm#Launch_Browser_hyperlinks